An extensive review of county-level COVID-19 case data in the United States reveals a complicated picture that in some ways challenges popular narratives about the role colleges and universities played in the pandemic’s spread, and in other ways reinforces them.
In short, U.S. counties containing colleges and universities have from the very beginning been home to the majority of new coronavirus cases detected. That’s in part to be expected -- these counties are home to about 90 percent of U.S. residents and include virtually every population center.
Adjust for the number of residents in each county, however, and it becomes clear that counties without a college or university have actually been recording proportionally more new cases per day since the beginning of August than have counties with a college.
That reality has significant implications for the idea that colleges and universities have turned into the country’s viral hot spots as students returned to campus this fall.
But the viral hot spot narrative isn’t wrong, either. An examination of certain individual counties’ data shows that some colleges holding in-person classes appear to be correlated with rising local rates of COVID-19 infection.
County case rates often increased in the days and weeks after colleges began classes. They sometimes dipped again, often after colleges and universities that had pushed in-person learning sent students home or imposed quarantines. But other times, new case rates have continued to rise or remain at high levels as campuses continue with the fall semester.
Additional Resources
The analysis in this article is based on data running through Sept. 15 that was downloaded from the Johns Hopkins University Coronavirus Resource Center Sept. 16. Inside Higher Ed is also publishing a set of resources that include additional days of data available as of Thursday afternoon:
An interactive map plotting the location of colleges and universities and showing 14-day average new case counts per 1,000 county residents as of Sept. 23
An animated map showing changes in 14-day average new case counts per 1,000 county residents from Aug. 1 through Sept. 23
A database of new cases per 1,000 county residents that is searchable based on the names of colleges and universities within each county
Separate analyses by the Associated Press and USA Today have reached similar conclusions in recent weeks. So has a working paper from a team of researchers at multiple universities.
The working paper used cellphone GPS data and county-level COVID data to examine people’s movement and COVID-19 incidence in counties over several weeks from mid-July to mid-September. It found colleges and universities that reopened for in-person instruction were associated with higher levels of new COVID-19 cases in their home counties for two weeks after their semesters began. The paper, which was released on a preprint server and has yet to be peer reviewed, also found that cases rose more in counties with colleges that drew students from areas of the country with rising infection rates.
Between 1,000 and 5,000 additional cases per day across the country are likely attributable to colleges reopening for face-to-face instruction, the paper found. The most likely estimate is that about 3,200 cases per day, or 21,000 cases per week, are tied to such reopenings. An increased flow of people on and around campus likely drives the increases, and even campuses that are primarily online tended to see a small increase in movement.
“The cellphone data shows even when you’re not going all in-person for classes, you’re moving people into that area,” said one of the paper’s co-authors, Kosali Simon, a professor in Indiana University’s O’Neill School of Public and Environmental Affairs and associate vice provost for health sciences. “This is just the reality. If you bring people into one place and you are going to test them, you are going to find cases.”
Important questions going forward include whether colleges are able to consistently stop the spread of COVID-19 among their students and whether campus outbreaks end up seeding the spread of infection in the wider community. In other words, will county case counts return to levels seen before campuses reopened? Will they continue to climb? Or will they settle at rates that are higher than earlier levels?
Inside Higher Ed’s analysis comes with several important caveats. It relies on case counts as recorded by the Johns Hopkins Coronavirus Resource Center. These case counts are dependent on levels of testing being performed and reported in communities, but this analysis does not take into account changes in testing levels on a county-by-county level. It also does not attempt to adjust for any inconsistencies in reporting methods between counties.
Importantly, this analysis does not show only those cases that are connected to a college or university, nor does it establish causality between college and university decisions and changes in local cases detected. Correlations often appear to exist, but it is entirely possible that other factors are being missed. Such factors could include K-12 schools reopening, governments relaxing business restrictions or an outbreak at another major local employer or institution. They could also include testing data being returned late or intermittently, among other things.
Counties With Colleges Versus Those Without
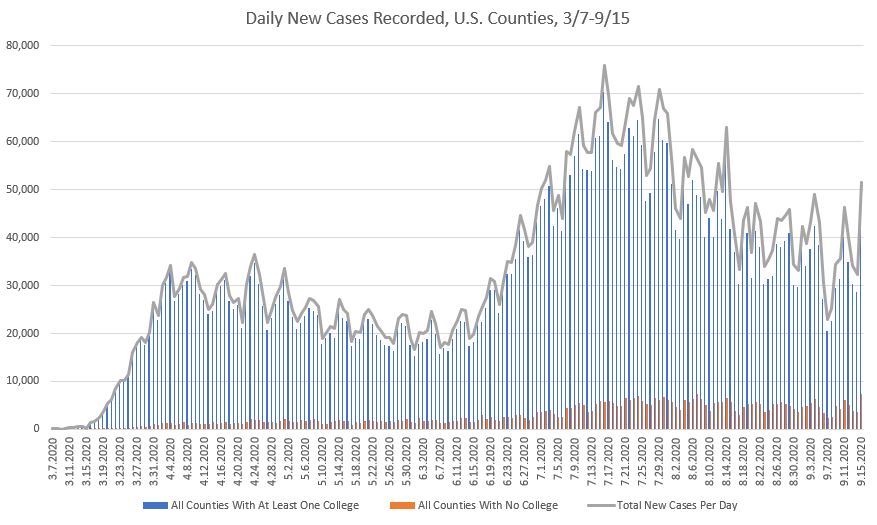
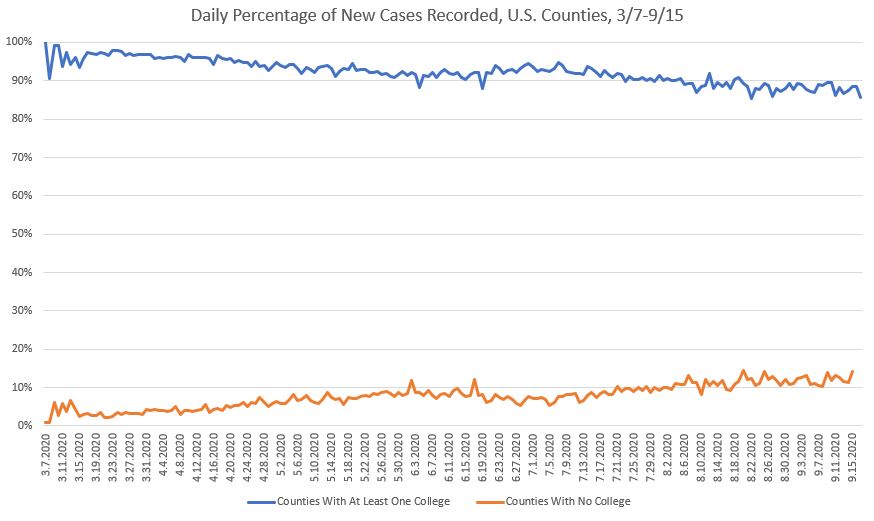
In the beginning of the pandemic, counties with at least one college made up almost all new cases reported in the United States. This was true in March, when colleges started moving instruction for the remainder of the spring semester online. It was true throughout the spring and summer.
But the counties containing at least one college also account for a huge majority of the U.S. population -- about nine out of every 10 people living in the country. So we would actually expect these counties to make up a vast majority of new cases. It’s more important to note what’s been happening over time to the percentage of all new cases recorded by type of county.
Counties without a college have steadily been accounting for a larger share of cases over time.
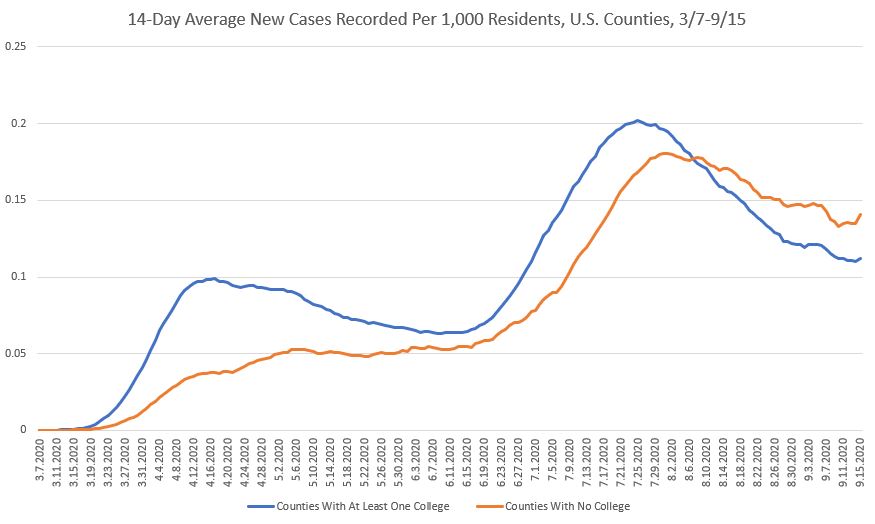
This is an important change given how many more people live in counties with at least one college than in those that don’t have any institution of higher education. The significance becomes clear if we adjust for the number of residents in each type of county.
The following graph adjusts for total population in our two types of counties, displaying new cases recorded per 1,000 county residents to make the numbers easier to digest. It also uses a 14-day moving average to smooth out day-to-day variability, making long-term trends clearer. It shows that counties without a college or university have since early August been recording more new coronavirus cases per capita than those with a college or university.
This is a vastly simplified picture of what’s actually happening, however. This analysis spans almost 3,200 counties in the country, almost 1,500 of which contain at least one college. But it also includes almost 6,600 colleges, meaning those counties with a college often have multiple colleges or universities within their borders. And each of those colleges and universities made different decisions about when to send students home, when to resume classes in the fall and whether to bring students back to campus for in-person classes.
So it’s important to use the data at hand to narrow the list of colleges and counties in order to find some interesting cases. We’ll do that next, continuing to look at the 14-day moving average number of new cases per 1,000 county residents. We’ll narrow the time frame to Sept. 1 through Sept. 15, a span of time covering many colleges’ plans to bring students back to campus.
Rising Cases to Start September
First, let’s start by evaluating 50 counties with the largest change in average new cases over the first half of the month. A majority of counties within this subset, 32, don’t have colleges or universities within their borders. The remaining 18 do.
It’s those 18 counties in which we’re interested. Notably, they’re much larger in population size than are the counties without colleges. Those in the subset with at least one institution of higher education totaled slightly less than 1.4 million people, compared to 380,556 in total for all of those counties without a college or university.
These 18 counties contain 36 different institutions. A few stand out for having multiple institutions: Leon County, Fla., is home to the city of Tallahassee and has eight different institutions of higher education. Tuscaloosa County, Ala., has four. Athens, Ga., has three.
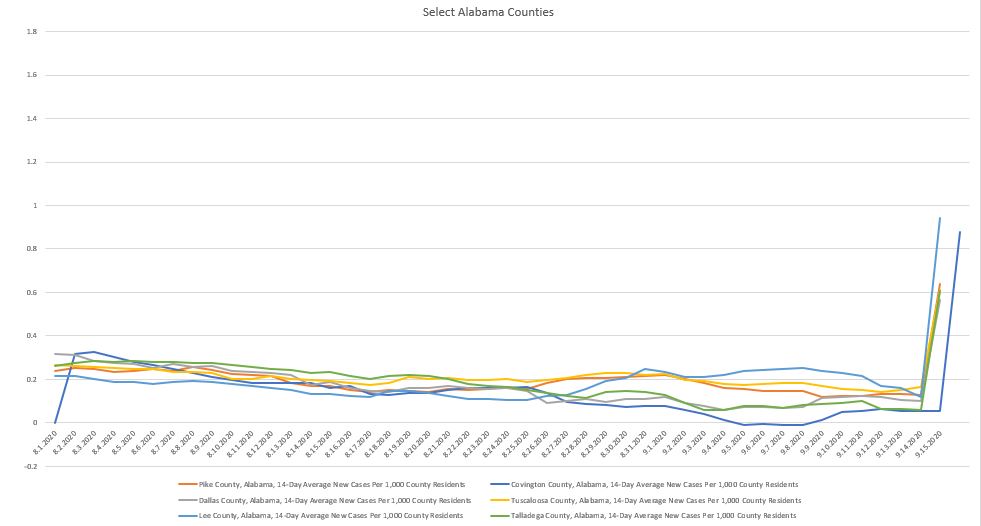
Of the counties within this set, six show a very similar pattern of new COVID-19 cases that spikes at the end of the time frame in question. All are in Alabama. So let’s set aside the Alabama counties in case something is unique about the data in the state. The University of Alabama’s high case counts are already well documented, anyway. (This issue might be corrected in a future data release, but for the sake of consistency, this article is based on data downloaded Sept. 16.)
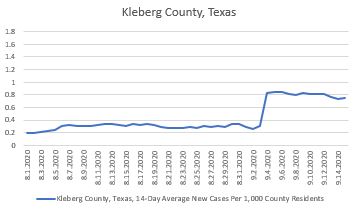
In the county, Texas A&M University-Kingsville reported seven total active cases between Sept. 13 and Sept. 19, all among students. Four of those were among individuals who hadn’t been on campus for two days prior to being tested or exhibiting symptoms. The university, which typically enrolls more than 8,500 students, tested 89 people in the week ending Sept. 20.
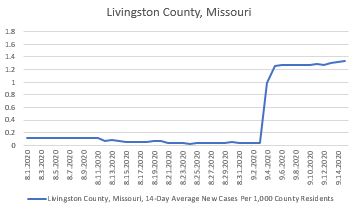
At face value, the data for the remaining institutions are less problematic and therefore more interesting for the purposes of evaluating potential interactions between colleges and county COVID-19 counts.
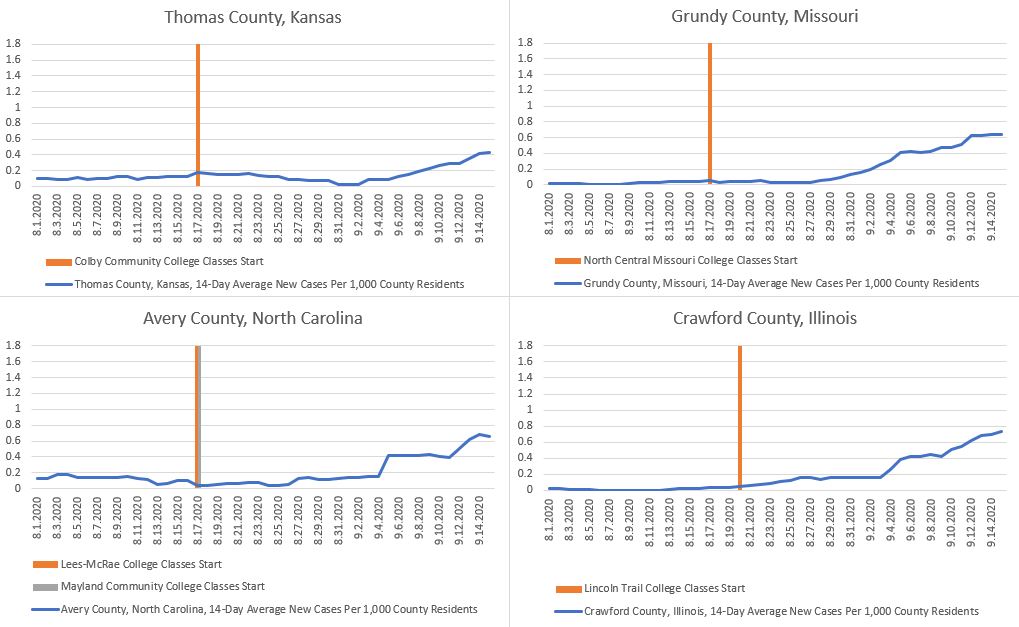
We’ll set aside some of the institutions flagged by this set of screens for discussion later. For now, let’s look at several counties that only contain community colleges that popped up in this batch.
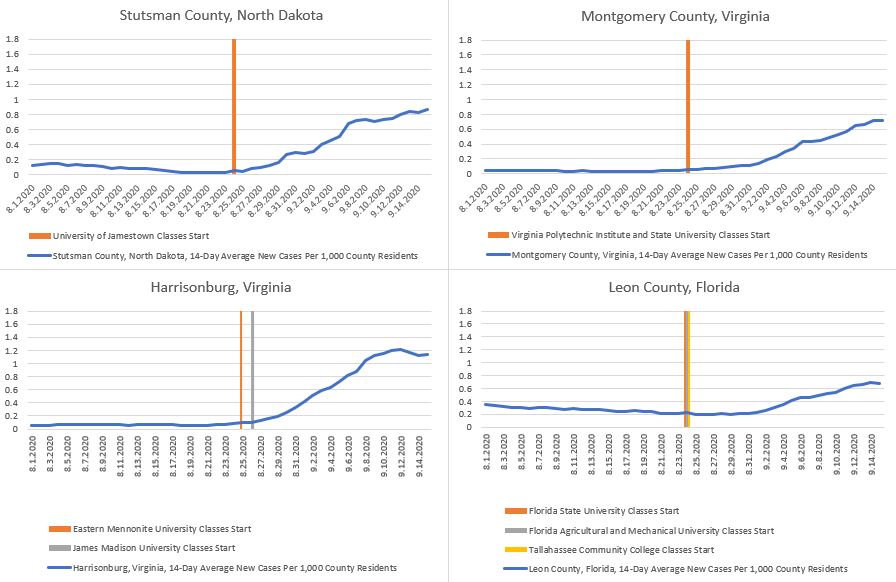
The following graphs show the scheduled start date of fall classes for higher education institutions that were the largest in their counties, plus some others that were close to the largest or of significant size in relation to county population.
Please remember that they do not show how many cases in a county can be traced back to a college or university. Nor do they differentiate between campuses that brought back all students for in-person instruction versus any holding all or most classes online. While the primary mode of instruction is an important distinction, it doesn’t necessarily capture how many students are living in dormitories or how many moved into off-campus housing under leases signed months ago.
Remember, these are 14-day moving averages. Given the coronavirus’s long incubation period and potential delays in testing results, any increase in new cases within two or three weeks of the start of classes is of interest.
Spread in the wider community and not on campus is likely driving county numbers in some jurisdictions, according to representatives of several institutions.
Colby Community College recorded its first confirmed case Sept. 14, four weeks after classes started. As of Sunday, its home of Thomas County, Kan., had 58 active cases, five of which were reported among Colby students or employees, according to Doug Johnson, the college’s public relations director.
North Central Missouri College has recorded only 19 positive cases among students, faculty and staff across multiple locations, said Kristi Harris, chief of staff at the college. Its enrollment averages between 1,700 and 1,800 in a typical year, plus another 250 faculty and staff members.
“We have remained relatively low in positive COVID-19 cases compared to our county percentage increase,” Harris wrote in an email. “We have intensive prevention and contact tracing procedures in place, and our students are doing a great job adhering to our prevention measures.”
Other community college representatives pointed to outbreaks at local correctional facilities as likely driving county case numbers.
“My understanding is that the increase in that time frame was the result of a large outbreak in congregate housing -- the local prison,” said a spokesman for Lincoln Trail College in Illinois, Chris Forde, in an email. “LTC has had no reports of COVID transmission tied to instruction on campus, although there have been LTC students who live in private housing who have been placed in isolation.”
The president of an institution in Avery County, N.C., Mayland Community College, said the same.
“We have not had much on campus,” said the president, John Boyd. “The big jump in Avery is in the prison.”
Echoing those comments was a spokesperson for a four-year private college located in Avery, Lees-McRae College.
“Lees-McRae College has only had three cases, and all of them occurred before the start of the fall semester,” said a spokesperson for Lees-McRae, Lauren Foster, in an email. “The increase in cases that you are seeing for Avery County occurred primarily in a congregate setting, which we’re hearing is the county jail.”
But it’s not clear how quickly some institutions would pick up any asymptomatic cases -- particularly those that are primarily commuter institutions or that don’t operate on-campus student housing.
For instance, Colby Community College in Kansas doesn’t perform batch testing or daily testing. It is only testing students when they exhibit symptoms, with its public relations director, Johnson, citing guidelines from the Kansas Department of Health and Environment and the U.S. Centers for Disease Control and Prevention.
Mayland in North Carolina doesn’t test students, either, relying on local medical providers to test any students who report symptoms. Nor does Lincoln Technical College, which, like its sister Illinois Eastern Community Colleges, requires faculty and staff members to self-monitor for symptoms before they come to campus.
Some public health experts found notable the number of counties with community colleges on the list.
“At least in our state, much more focus, testing and surveillance was put on the residential colleges,” said Summer Johnson McGee, dean of the school of health sciences and COVID coordinator at the University of New Haven, in Connecticut. “Community colleges are an area that has really been overlooked.”
Community colleges are still places where students gather and congregate, even if they don’t have as many students traveling from across the country to live in dormitories or off-campus student housing.
“Everybody was so concerned about the residence halls,” McGee said. “What we’re seeing is there is just as much risk in spread off campus.”
Several other counties with colleges or universities were flagged in this evaluation or rising cases during the first half of September. They include Stutsman County, N.D.; Harrisonburg, Va.; Montgomery County, Va.; and Leon County, Fla.
In Stutsman County, N.D., the University of Jamestown has recorded a COVID-positive student count in the “low 40s,” according Tena Lawrence, executive vice president. That wouldn’t be enough to account for the county’s total number of positive cases, which jumped by more than 250 between Sept. 1 and Sept. 15.
The university is also testing students regularly. It conducted more than 1,200 tests over the last four weeks, for example. County health officials provide weekly testing for its students.
One jurisdiction to watch in particular will be Harrisonburg, Va. James Madison University announced a temporary switch to online instruction at the start of September amid a quick increase in positive cases -- it reported 80 students testing positive on Sept. 4 alone. Last week James Madison announced a return to in-person learning planned for Oct. 5. Another university in town, Eastern Mennonite University, has reported eight cumulative cases since Aug. 2.
Highest New Confirmed Cases
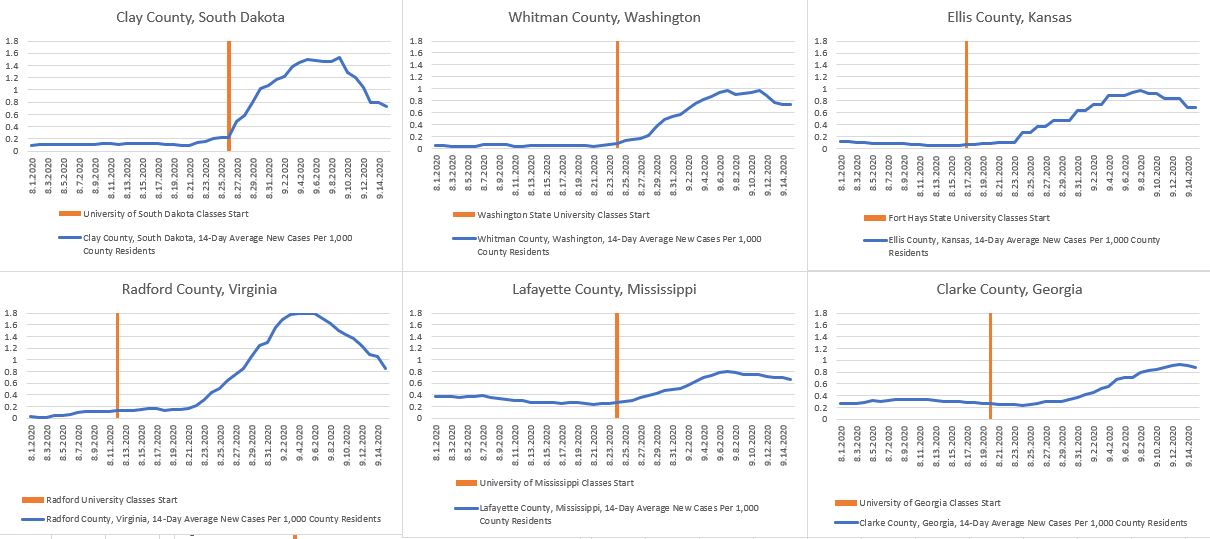
Now let’s also look at the counties containing colleges with the absolute highest 14-day average new confirmed cases per 1,000 residents on Sept. 15, regardless of whether case numbers have been rising or falling. In theory, this could show us some counties with a high rate of infection but no spike.
This evaluation returns Pike County, Ala., and Kleberg County, Tex., both of which we’ll eliminate because of previously mentioned issues with the data. It also returns Montgomery County, Va., and Harrisonburg, Va., both of which are graphed above and not duplicated below.
Some of the counties below also host multiple colleges and universities within their boundaries, but to keep things simple, we’ll look only at start dates for their largest institutions.
A relatively distinct rise becomes apparent as August ends and September begins in virtually every case.
Representatives from some of the institutions located in these counties said they were encouraged by recent dips at the end of the period.
The University of Georgia, for example, pointed to a 70 percent week-over-week decline in positive cases it reported. The university reported 421 positive cases for the week of Sept. 7 to Sept. 13, although its surveillance testing positivity rate only declined from 9.08 percent to 7.61 percent.
No evidence has been found showing COVID-19 spreading through classrooms, according to a University of Georgia spokesman, Greg Trevor. The university is testing students and isolating or quarantining them when needed.
“The challenge in the Athens-Clarke County community is controlling the spread of the virus at downtown bars or off-campus parties. Both of those issues are under the control and jurisdiction of the local government,” Trevor said in an email.
Clarke County showed up in both this set of screens and the screen above for counties with the largest change in average new cases per county resident.
The spike in Clay County, S.D., was mostly comprised of students, according to Kevin O’Kelley, assistant vice president of research compliance and the head of the University of South Dakota’s COVID-19 Case Management Team.
When University of South Dakota leaders saw a spike in cases despite earlier preparations, they put additional control measures in place -- closing in-house seating in dining halls, shutting down the campus wellness center, asking local bars and restaurants to close early on weekends, canceling some events, and telling students that they need to tamp down the virus’s spread if they want to remain in town.
O’Kelley said those measures have worked. Infection levels peaked and started tapering, although they’ve yet to return to the low levels seen before the end of August.
“We are not basking in our success,” O’Kelley said in an email. “COVID-19 is still here, and we understand very well that the graph you refer to does not consist of numbers, it consists of sick students. They have been, and remain our number-one concern. All of the mechanisms we put in place to deal with the surge are still in place. We are being vigilant, and are ready to ratchet down again if we need to.”
Washington State University canceled face-to-face classes in July, moving instead to virtual learning for the fall. But more students than expected returned to the Pullman, Wash., area, as many had signed leases for off-campus housing, according to a university spokesman, Phil Weiler.
The university saw positive cases related to off-campus housing and launched a testing campaign that included mobile testing units for areas with large student renter populations. It also stood up an on-campus testing facility, and free testing is now available six days per week to students.
“We have seen a steady drop in our positivity rate,” Weiler said in an email. “In addition, the vast majority of students who tested positive have completed their isolation period and have now recovered. While we still have work to do, the indicators are trending in the right direction.”
A representative from Radford University, in Virginia, said positive cases detected through campus-based testing have been falling in recent weeks.
“In reviewing the weekly dashboard updates, coupled with data shared by the Virginia Department of Health on a daily basis, it is very clear that positive cases in Radford have plateaued and subsequently declined,” said Caitlyn Scaggs, Radford’s associate vice president for university relations, in an email. “The Virginia Department of Health, specifically the New River Health District, through Director Noelle Bissell, M.D., recently shared, ‘Radford University has been the model of how to manage the return of students to campus during this pandemic. Together, we have weathered the storm. We are through the worst of it. What has happened is exactly what we predicted, and there have been no signs of community transmission.’”
Other Counties of Interest
One more group of counties helps to shed some light on the patchwork of situations across the country. Several institutions drew a great deal of news coverage because they proved to be coronavirus hot spots after they brought students back to campus. What do the data look like for the counties in which they are located?
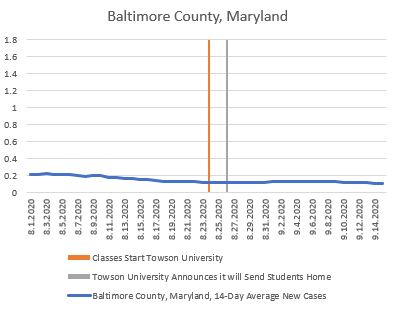
Some of these institutions shut down in-person undergraduate instruction in response to rising case counts, sending students home. Others quarantined students for two weeks, while still others pushed through while warning students but announcing no sweeping changes.
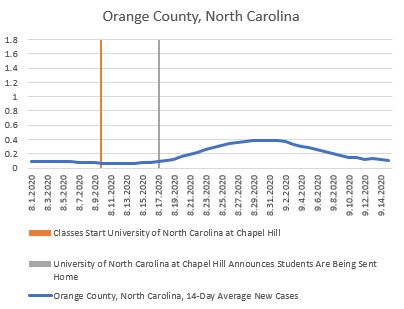
The number of new cases per county resident was hardly even showing up in data before the university announced it was sending students home. Nonetheless, detected cases spiked in subsequent weeks before slipping back down. Of note here is that Chapel Hill enrolls about 30,000 students, while the county that holds it is about five times larger, at nearly 150,000 people.

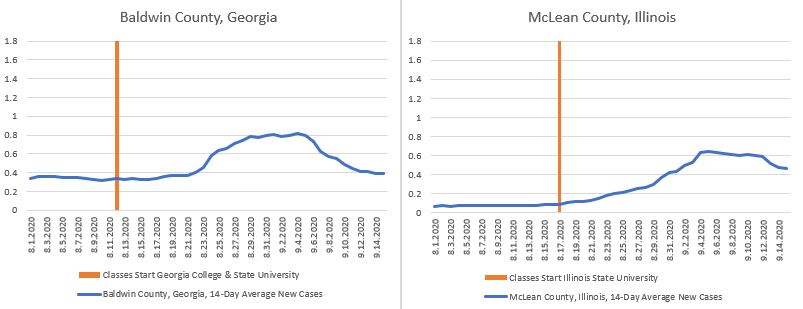
Two more institutions, Georgia College and State University and Illinois State University, have drawn attention for a large number of cases on campus. Illinois State enacted emergency measures after more than 1,000 students tested positive two weeks into the fall semester. Georgia College has drawn sharp criticism from students and staff members who late last month demanded online learning options for students, among other steps to stop the spread of a virus that had infected 8 percent of students at the time.
Notable in both of these cases is that the average infection rates spiked in the institutions’ home counties before declining. But as of the middle of the month, they’d yet to fall back to summertime levels. Illinois State enrolls over 20,000 students in a county with 171,000 residents. Georgia College enrolls about 7,000 in a county with just under 45,000 residents.
Finally, let’s look at two state flagship research universities whose approaches to testing and contact tracing stand in stark contrast. The University of Illinois at Urbana-Champaign, which emphasized that testing students twice a week would allow it to detect and head off any major outbreaks, announced a two-week lockdown through Sept. 16. Penn State, which like many universities has a much lighter surveillance testing regimen, has made no such announcement.
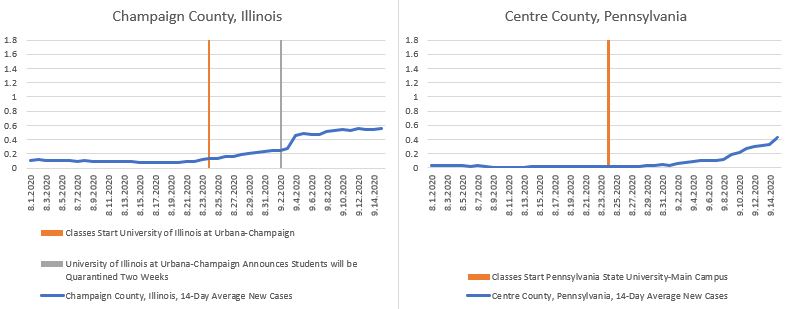
The University of Illinois at Urbana-Champaign counts a total of nearly 50,000 students, compared to a county population of just under 210,000. Penn State’s main campus has about 47,000 students and a county population of 162,000.
Penn State’s director for news and media relations, Lisa Marie Powers, pointed to a “multilayered approach” the university is taking to mitigate the risk of disease spread on campus and, by extension, in the surrounding community. The university is adjusting as it learns more, including adding more testing.
Efforts to monitor whether the virus is spreading in the community around Penn State include daily data checks, monitoring hospital capacity, conferring with the Pennsylvania Department of Health, monitoring wastewater from the larger State College community and testing community members who volunteer, according to Powers.
“The data we are gathering through both on-demand and random testing is shared on our public dashboard and we publish the information two times per week to keep our community informed,” Powers said in an email. “The Pennsylvania Department of Health is conducting pop-up testing to better understand the question of community spread, so it is premature to attempt to extrapolate, speculate or make conclusions at this point.”
Considerations for the Future
The data leave public health experts and higher education leaders with much to consider as they navigate any additional on-campus outbreaks this fall, consider the challenge of sending students home between semesters and make plans for the spring.
Whether or not infections around different college campuses drive higher levels of COVID-19 spread in surrounding communities is a key question going forward.
College and university students are often thought of as among the least likely to suffer complications from the coronavirus, even though they are not immune and the long-term health implications of even mild infections aren’t fully known at this time. Regardless, students can still spread the virus, leaving open the potential for a large number of asymptomatic students on campus to incubate infections that then jump to older, sicker populations who are more at risk of serious complications.
“Universities, for the most part, are situated in places where there is a lot of interaction with the city and community and college or university,” said Tom Inglesby, a physician who is director of the Johns Hopkins Center for Health Security, who consulted with Maryland governor Larry Hogan on the state’s coronavirus response, in an August interview. “So university leadership has to be thinking about all interactions in the city or town or community.”
The apparent effectiveness of quarantines jumped out at some experts. Campuses may need to continually be ready to detect outbreaks quickly, quarantine students for two weeks and then re-evaluate whether case counts have fallen enough to end the quarantine.
“It looks like quarantine works,” said McGee, of the University of New Haven. “It looks like the rest of us are going to go with a strategy of test, test, test, and when you find positives, quarantine and continue operations as best you can.”
What does that say about quarantining students before next semester starts -- or as this one ends? And what does it mean for institutions that don’t have access to testing capacity?
The questions themselves aren’t necessarily new. They’ve been around for months. What is new is the way different institutions’ answers appear to be playing out in the real world.
“What I think is important is looking forward and learning what strategies are effective,” said Simon, of Indiana University. “It’s not just the fact that the reopenings had this effect. It’s not surprising. Let’s learn about how to find the efforts that have the most bang for the buck.”
"case" - Google News
September 25, 2020 at 02:06PM
https://ift.tt/3448SvM
Data reveal complex picture between colleges and county COVID-19 case counts - Inside Higher Ed
"case" - Google News
https://ift.tt/37dicO5
https://ift.tt/2VTi5Ee
Bagikan Berita Ini


0 Response to "Data reveal complex picture between colleges and county COVID-19 case counts - Inside Higher Ed"
Post a Comment